Citizen weather station obstruction profiles
This is a short story of how we are using an algorithm we wrote to help understand the "legibility" of a city, to assist climate researchers Dr. Kate Saunders (a lecturer at Queensland University of Technology) and Dr. Kirien Whan (a research associate at The Royal Netherlands Meteorological Institute).
One of the most enjoyable parts of working with mathematics is realising that many seemingly unrelated problems in the world can be represented by the same mathematical concepts. I don't know about most mathematicians, but for me, reading about and discovering ways in which people have represented a problem mathematically and then been able to use well known solutions, in that new domain, to solve it, is inspiring and motivating.
A few months back, Dr. Saunders and Dr. Whan won The Harry Otten Prize for Innovation in Meteorology, for their idea "Second Wind: Extending the official wind gust record with citizen science observations". Official weather stations were built a long time ago and are expensive to maintain. As such, there are many places where official weather stations are missing. Thanks to technology today, you can purchase a wind sensor and place it somewhere on your property. Some people place sensors on their rooftop or next to their windmill. Climate scientists refer to these as "citizen weather stations" (CWSs). If you have one, you can upload the data it collects on to a Weather Observation Website (see: here for the UK, and here for the Netherlands).
In the Netherlands (and most of the world!) the station coverage differences are stark.
Official weather stations
Citizen weather stations
This data, although not official, can help augment weather models. However, it first needs to be cleaned. Dr. Saunders and Dr. Whan have been researching how to do just that.
"Wind observations collected at citizen weather stations (CWSs) could be an invaluable resource in climate and meteorology studies, yet these observations are underutilised because scientists do not have confidence in their quality.
These wind speed observations have systematic biases, likely caused by improper instrumentation and station sitings. Such systematic biases introduce spatial inconsistencies that prevent comparison of these stations spatially and limit the possible usage of the data.
In this paper, we address these issues by improving and developing new methods for identifying suspect observations and adjusting systematic biases."
- Jieyu Chen, Kate Saunders, and Kirien Whan.
"Quality control and bias adjustment of crowdsourced wind speed observations." Quarterly Journal of the Royal Meteorological Society 147.740 (2021): 3647-366
We know buildings can affect wind observations collected at a station. Buildings obstructing wind observations are likely a much bigger problem for CWSs, that are often placed in an urban environment, compared to official stations which measure wind speed in an open field.
The question is - can we use this information in a mathematical model to find high-quality, unobstructed CWSs?
The figure above shows how wind would travel through an unobstructed area, and then through one with obstructions - ie. a town, demonstrating one way in which the obstructions could change the station's observations.
We are collaborating with Dr. Saunders and Dr. Whan by using our geospatial analysis engine and OSM data to create obstruction profiles for weather stations (official and citizen ones) in the Netherlands. We hope that these profiles can be used to identify potential biases in the station's measurements. There are some assumptions we are currently making that will need to be addressed, like using a two-dimensional representation of the world, or assuming the only obstructions are buildings. But we are excited to be involved in this project, and are looking forward to sharing our findings as we progress. This is just the beginning.
An example of a CWS 2km obstruction profile (info on this station here)
The figure above shows an example of a 2km obstruction profile we calculated for a CWS (shown in black, in the centre). The profile is created by considering any building around it as an obstruction, up to 2km away. If the station was in an area with no surrounding buildings in a 2km radius, then the profile would be a full 2km radius circle. If you zoom in, you can see the buildings which have created obstructions.
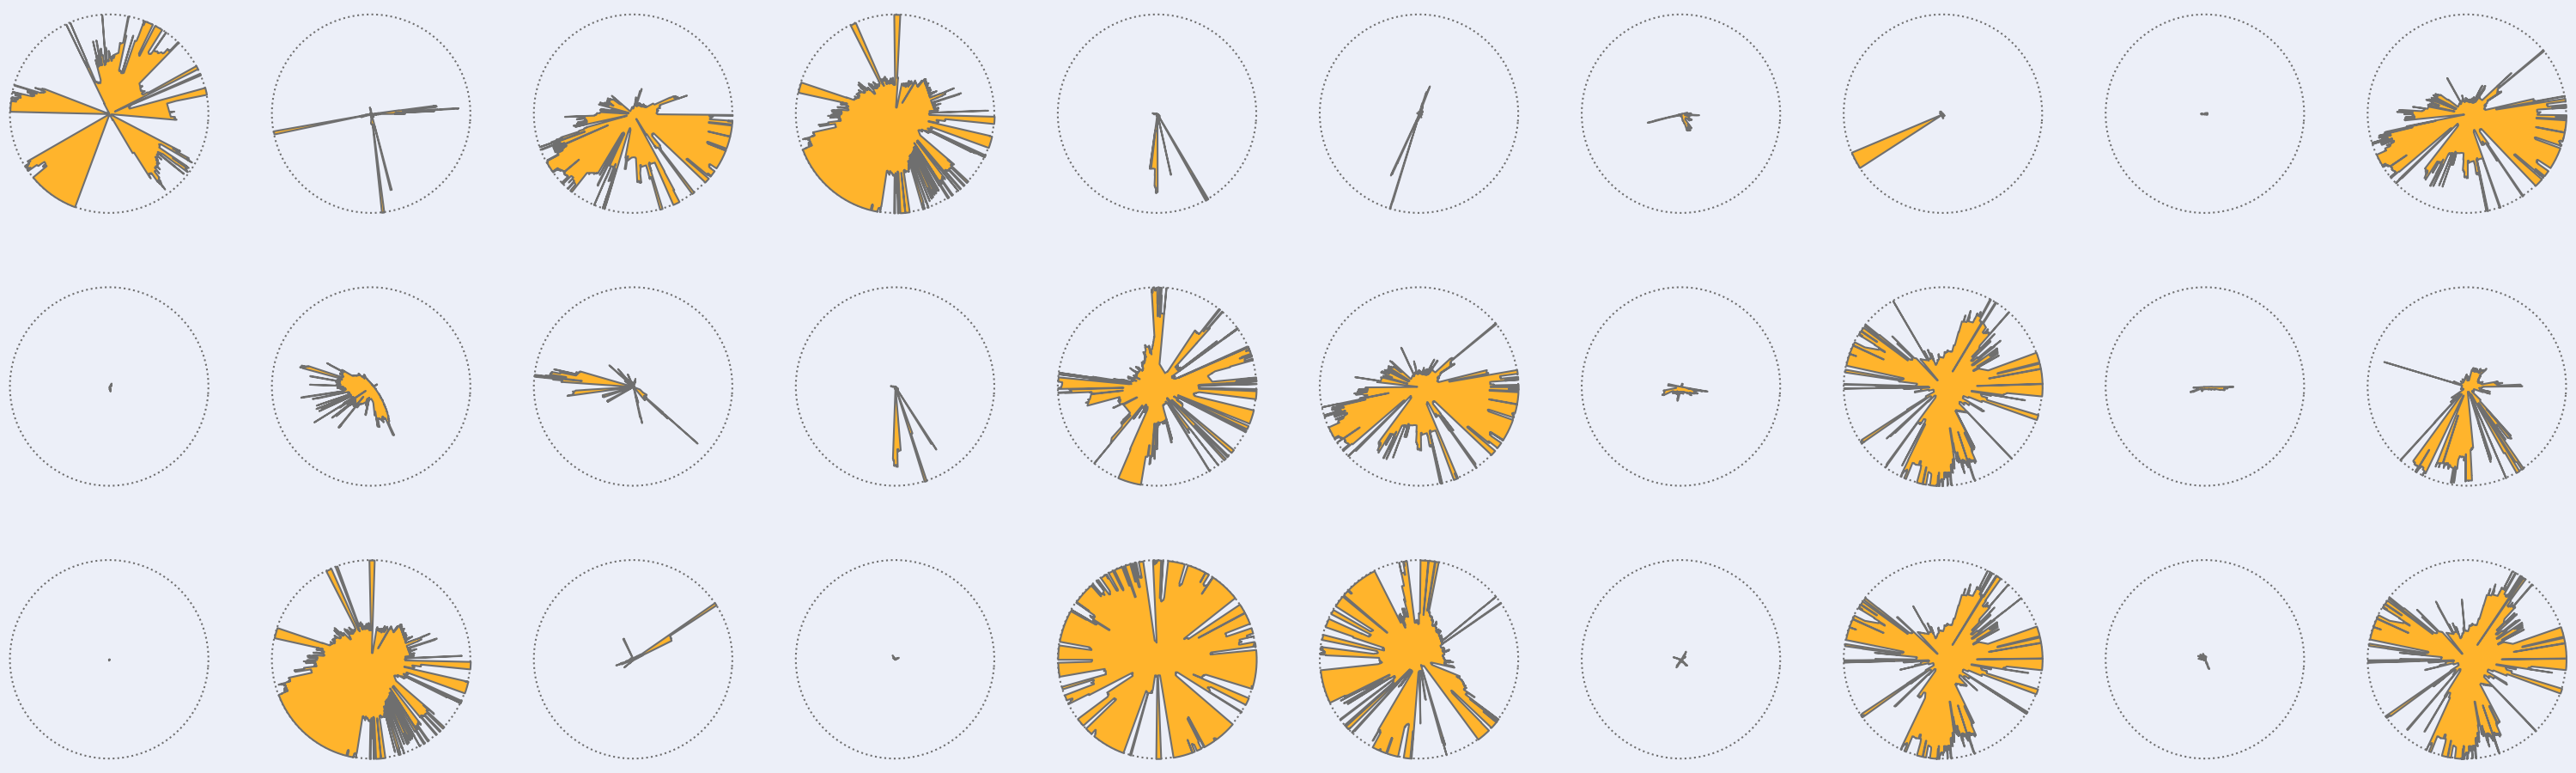
The figure below shows a few 2km obstruction profiles we calculated for both offical weather stations and CWSs, along with the 2km boundary, for context. It has been so interesting to see the different shapes and sizes of the profiles. Some of these profiles are for stations located only a few hundred meteres away from each other.
We are excited to support Dr. Saunders and Dr. Whan in their research, which elevates the power of citizen science. You can learn more about them and their project by listening to this podcast.
If you are working on climate science analysis, or the impacts of climate change on the built environment - we would love to hear from you. Get in touch.